Analytics & AI Module: Unlock the Full Potential of Your Organization’s Data
With the Analytics & AI module, #DIESE opens a new chapter in data utilization. Custom queries, real-time exports, and natural language analysis empower teams with autonomous, reliable, and secure access to their data.
Data is everywhere – but rarely fully leveraged
In cultural organizations, data is everywhere: artistic planning, workforce management, contracts, budgets, inventories.
Yet in many cases, this data remains underused.
Why? Because access often depends on:
- complex technical queries
- manual exports
- or specialized data skills
The result: time lost, duplicated work, and limited visibility for decision-making.
A new way to interact with your data
The Analytics & AI module introduces a fundamentally different approach: enabling every team to access and analyze data independently – without technical expertise.
The goal: turn existing data into a practical decision-making tool.
Custom queries anyone can use
The module provides a library of queries organized by business area: planning, workforce management, contracts, budget, and more. Additionally, each query is customisable, to allow for a bespoke configuration of the export.
In practice, this means users can extract any data from the system – without relying on technical teams.
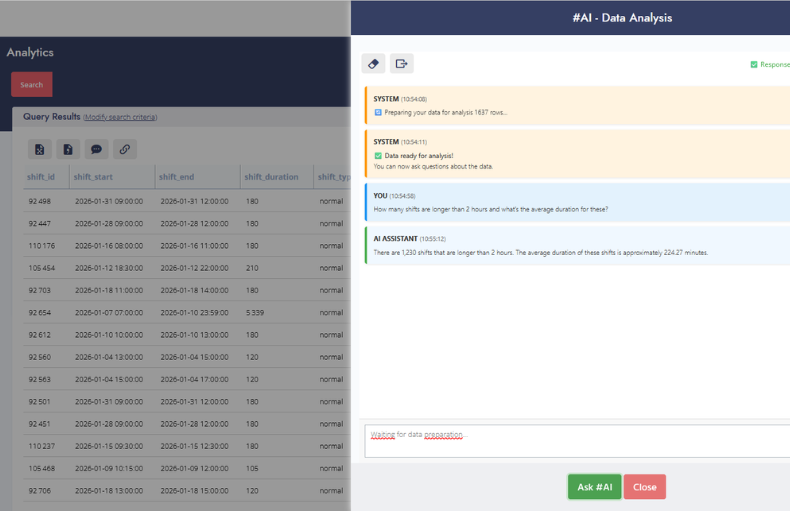
AI designed for real-world use
The module also introduces a key innovation (as an activable option): conversational AI for data analysis.
Ask your data questions in plain language
Users can simply ask business questions such as:
- “How many performances per production type this season?”
- “When is the rehearsal room available next week?”
The AI analyzes the data and provides:
- statistics
- trends
- explanations
- additional insights
This approach makes advanced analysis accessible to everyone.
It also helps teams gradually build confidence in using data more strategically.
A new milestone for #DIESE
With this module, #DIESE takes a significant step forward – transforming structured data into a true operational asset.
Want to unlock the full potential of your data in #DIESE?
Let’s talk about your needs and schedule a personalized demo of the Analytics & AI module.